Macro regimes are useful because they compress a large, noisy information set into a state that people can discuss. They are dangerous for exactly the same reason. A tidy label such as expansion, stagflation, or contraction can make a probabilistic and revisable judgment look like an observed fact.
The better question is not “which regime are we in?” It is: what evidence is moving, how consistently is it moving, and how much confidence should we place in the current map? A regime should be the final layer of that explanation—not a replacement for it.
This note sets out a practical research design for doing that. It is an interpretive framework, not a live model, forecast, or investment signal. Every chart below is deliberately labelled illustrative.
A regime is a map of the evidence. It is not the territory, and it should never hide the route used to draw it.
Start with a continuous evidence field
Hard quadrants are attractive: growth is either strong or weak; inflation is either rising or falling. But the underlying measures rarely cooperate. Releases arrive on different schedules, series are revised, survey and activity data can disagree, and “strong” depends on whether the relevant comparison is a level, trend, surprise, or rate of change.
A more honest starting point is a continuous evidence vector. For each information date, group observable inputs into a small number of economically legible families:
- growth impulse—breadth and direction across output, income, labour, demand, and forward-looking surveys;
- price pressure—the level, breadth, and momentum of inflation rather than one headline print;
- policy and liquidity—the stance and direction of monetary and financial conditions;
- stress and transmission—whether credit, funding, volatility, or market functioning is amplifying the macro move.
Each family can be represented by several robustly transformed indicators. The aim is not to maximise the number of inputs. It is to reduce dependence on one noisy series while preserving a clear account of what moved the result.
A path through the evidence field
Illustrative / not observed data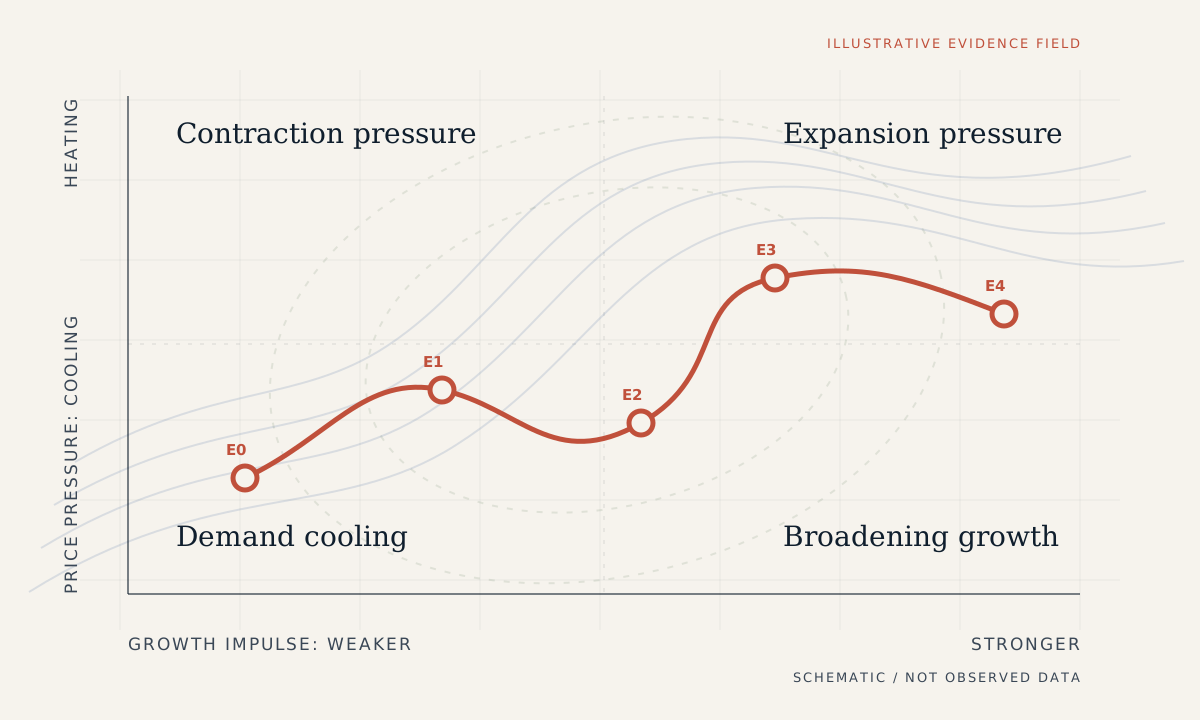
The path matters as much as the destination. Two periods can occupy a similar point in the field while having very different implications: one may be stabilising after a sharp deterioration, while the other is losing momentum from a strong base. A state estimate should therefore retain at least three pieces of information:
- the current location in the evidence field;
- the direction and speed of travel;
- the recent path taken to get there.
This is the first guardrail against false precision. A discrete label is allowed, but it remains attached to the continuous evidence that produced it.
Transform indicators without erasing their meaning
Combining heterogeneous series requires a common scale. That does not justify treating every observation as interchangeable. A robust transformation pipeline might include:
raw vintage
  -> release-aware observation
  -> economically appropriate change or spread
  -> robust standardisation within a causal window
  -> direction alignment
  -> family-level aggregation
The words appropriate and causal do most of the work. A diffusion survey, an unemployment rate, and an inflation index do not carry the same semantics. Some series are meaningful in levels; others in changes, accelerations, spreads, or breadth. The transformation should be declared per indicator and tested against its economic interpretation.
Standardisation also needs an information boundary. A full-sample mean and standard deviation allow future history to reshape the past. For historical research, expanding or rolling estimates should use only data that would have been available on the evaluation date. If vintage data are unavailable, the limitation should be visible rather than quietly ignored.
Family aggregation can then use a robust centre, trimmed weighting, or another explicit rule. Weighting should reflect the question and data quality—not merely which optimisation produced the cleanest backtest. A useful output retains contributor-level values so a reader can distinguish broad agreement from one dominant input.
Keep state and confidence separate
A common design mistake is to place “neutral” in the middle of the state scale and assume it represents uncertainty. It does not. Neutral evidence can be estimated with high confidence; strong directional evidence can be supported by sparse or contradictory data.
State answers what does the available evidence indicate? Confidence answers how much support does that indication have? These should be separate fields in the public contract.
A practical confidence assessment can be decomposed into four inspectable parts:
| Confidence component | Question | Example penalty |
|---|---|---|
| Coverage | How much expected evidence is currently available? | Missing or stale releases. |
| Agreement | Do independent indicators point in a similar direction? | Survey and activity measures diverge. |
| Stability | Is the estimate robust to modest specification changes? | One transformation flips the state. |
| Boundary distance | Is the evidence clearly inside a state or near a threshold? | Small data changes alter the label. |
Evidence is not confidence
Illustrative / not observed data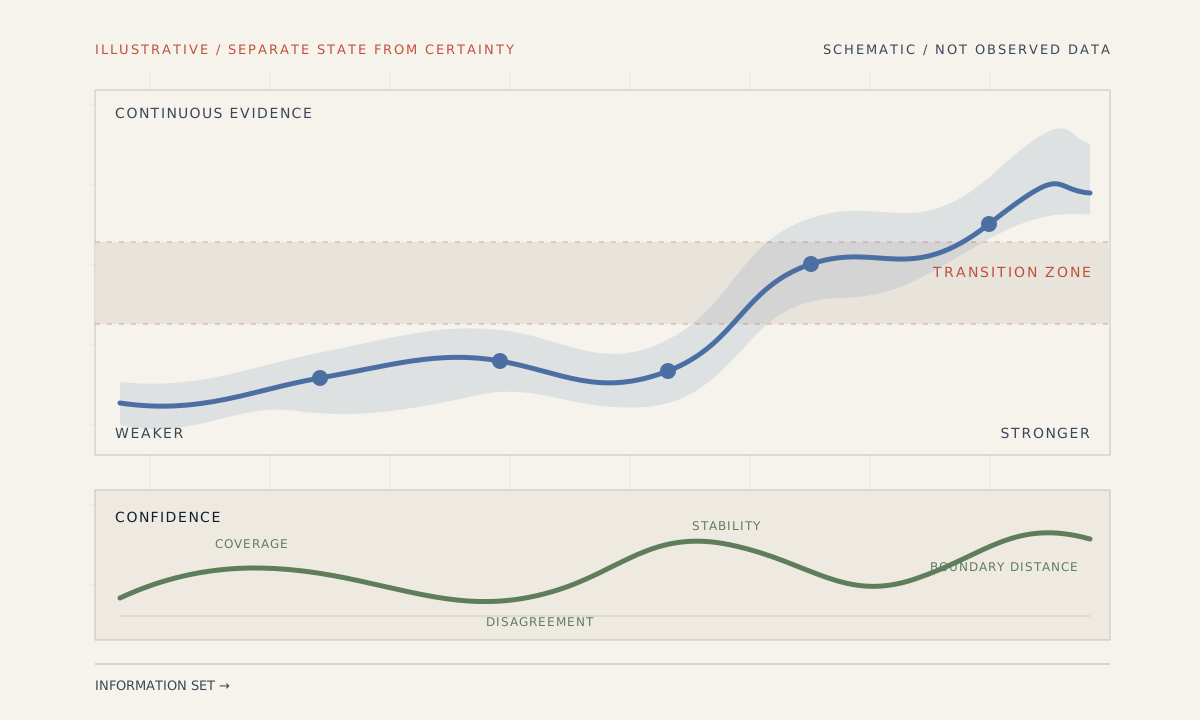
This decomposition is more useful than one opaque probability because it points to an action. Low coverage may require waiting for releases. Low agreement may call for contributor review. Low stability may expose an overly sensitive specification. Proximity to a boundary may simply require softer language.
Probabilities can still be helpful, particularly in a formally estimated latent-state model. But they should not be described as objective confidence unless the calibration is tested out of sample. A model assigning 80% to a state is making a conditional statement under its assumptions; it is not reporting that the macroeconomy is “80% expansion.”
Treat transitions as first-class states
The least credible regime systems teleport between labels. One release arrives, a threshold is crossed, and the historical chart redraws the economy overnight. This creates churn precisely when the evidence is mixed and decisions are most sensitive.
Transitions deserve their own representation. Several mechanisms can help:
- hysteresis: require stronger evidence to enter a state than to remain in it;
- persistence: require the candidate state to survive more than one information update;
- breadth gates: require movement across more than one evidence family;
- confidence gates: prevent a label change when coverage or stability is inadequate;
- transition language: publish “moving toward” or “transition risk” before asserting a settled state.
These controls should not be tuned merely to make the line look smooth. Excessive persistence can conceal a real turning point. The objective is to distinguish a durable change in evidence from threshold noise while preserving the ability to react when several independent inputs move together.
A state change is a process
Illustrative / not observed data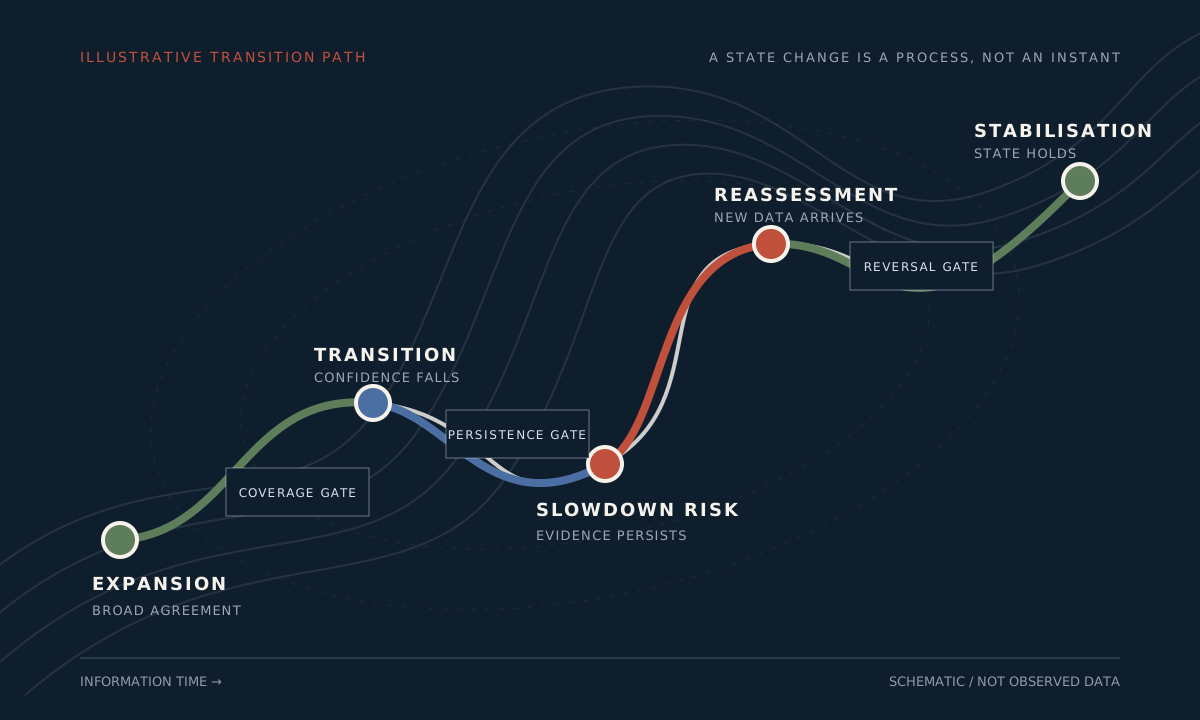
The path view also improves explanation. Instead of saying “the model moved from expansion to slowdown,” the system can report that growth breadth weakened, price pressure cooled more slowly, credit stress remained contained, and confidence fell because the evidence families disagreed. That account is longer, but it is also reviewable.
Make the information set explicit
A regime history is only credible if each historical estimate respects what was knowable at the time. This is difficult in macro data because observation, release, retrieval, and revision dates differ.
For every evaluation date, the research system should be able to answer:
- which source vintage supplied each observation;
- when that value was first available;
- which transformations and parameters were active;
- which inputs were missing or stale;
- whether the displayed state is the original estimate or a later reconstruction.
There are two legitimate historical products, but they answer different questions. A real-time map reconstructs the signal using the releases and vintages available then. A revised-history map uses the best currently available data to interpret the period with hindsight. Both can be useful. Mixing them creates an invalid backtest.
Retrospective cycle chronologies provide valuable reference points, but they are not a substitute for a real-time state estimate. The NBER, for example, explicitly waits for sufficient evidence before dating US peaks and troughs. A research system designed for current monitoring faces a different trade-off between timeliness and confirmation.
Validate the map, not just the returns
If a regime framework will inform research or risk discussion, validation should begin before any portfolio backtest. Otherwise the state definition can be reverse-engineered around the asset behaviour it is later claimed to explain.
Useful validation questions include:
Is the state reproducible?
Given the same input vintages, configuration, and code version, the process should produce the same contributors, family scores, state, and confidence record.
Is the map stable for the right reasons?
Small, economically immaterial changes should not rewrite years of history. Genuine data revisions or corrected source mappings may change an estimate, but the difference should be attributable and stored.
Does the state have economic coherence?
Contributors should tell a recognisable story. If a state is driven by unrelated technical artefacts, unstable seasonal effects, or a single series with an extreme scale, the label is not doing useful compression.
Are probabilities and thresholds calibrated?
Walk-forward evaluation should measure transition frequency, dwell time, revision rate, coverage, boundary behaviour, and probability calibration. These checks are important even if no asset returns are used.
Does it remain useful outside the fitted sample?
Definitions, weights, and thresholds should be frozen before evaluating later periods. Stress periods deserve particular attention because missingness, revisions, and correlation shifts can invalidate assumptions formed in quieter data.
Only after these tests should researchers ask how market behaviour differs across states. Even then, the regime is a conditioning variable, not a trading recommendation.
Publish an evidence packet, not a badge
The final output should make inspection easy. A compact regime record could expose:
as_of:             information timestamp
state:             published descriptive label
candidate_state:   state under transition review
state_probability: model-conditional probability, if calibrated
confidence:        coverage / agreement / stability / boundary distance
direction:         recent movement through the evidence field
contributors:      family and indicator-level evidence
missingness:       absent, stale, or quarantined inputs
vintage_manifest:  source payload and transformation lineage
method_version:    immutable configuration identifier
The public interface can remain simple while the detail is available on demand. A reader should be able to move from label, to evidence family, to contributing series, to source vintage without encountering a different definition at each layer.
This approach also makes language more disciplined:
- say “evidence is consistent with”, not “the economy is”;
- say “confidence is limited by”, then name the limitation;
- describe direction and transition, not only the current box;
- distinguish a real-time estimate from a retrospective classification;
- record when evidence is insufficient to publish a state at all.
What this framework does not solve
No regime map removes model risk. The selection of indicators embeds a view of the economy. Aggregation can hide local divergence. Structural change can make old thresholds irrelevant. Global and domestic cycles may conflict, and the state appropriate for one decision horizon may be unsuitable for another.
Nor does explainability guarantee correctness. A transparent model can be wrong in ways that are easy to inspect; an opaque model can sometimes forecast well. The case for transparency is that it supports challenge, governance, and controlled improvement when the model fails.
The practical objective is therefore modest: compress complex evidence without erasing uncertainty. The map should help a researcher see where the evidence sits, how it is moving, why the current description was chosen, and what would cause that description to change.
That is enough. A regime framework becomes more useful when it claims less precision than the chart is capable of displaying.
Sources and scope
- Hamilton, J. D. (1989), “A New Approach to the Economic Analysis of Nonstationary Time Series and the Business Cycle,” Econometrica.
- Ang, A. and Timmermann, A. (2012), “Regime Changes and Financial Markets,” Annual Review of Financial Economics.
- NBER Business Cycle Dating Committee, chronology and methodology.
This article describes the repository state at publication and is for research and information only. It is not investment advice.